|
AIOps – GenAI capabilities 
SmartGENie - Generative AI-Driven IT Incident Management
|
![]() |
|
|
The proprietary feature of SmartOps-AIOps that uses Generative AI capability to generate summary of a given ticket and its alerts that includes.
- Overview
- Alert events considered for this report
- Probable root cause
- Troubleshooting steps / Recommended resolution steps
- Current status
- Conclusion
|
How does it work?
Navigation: AIOps > Alerts > SmartGENie wand icon next to each alert cluster
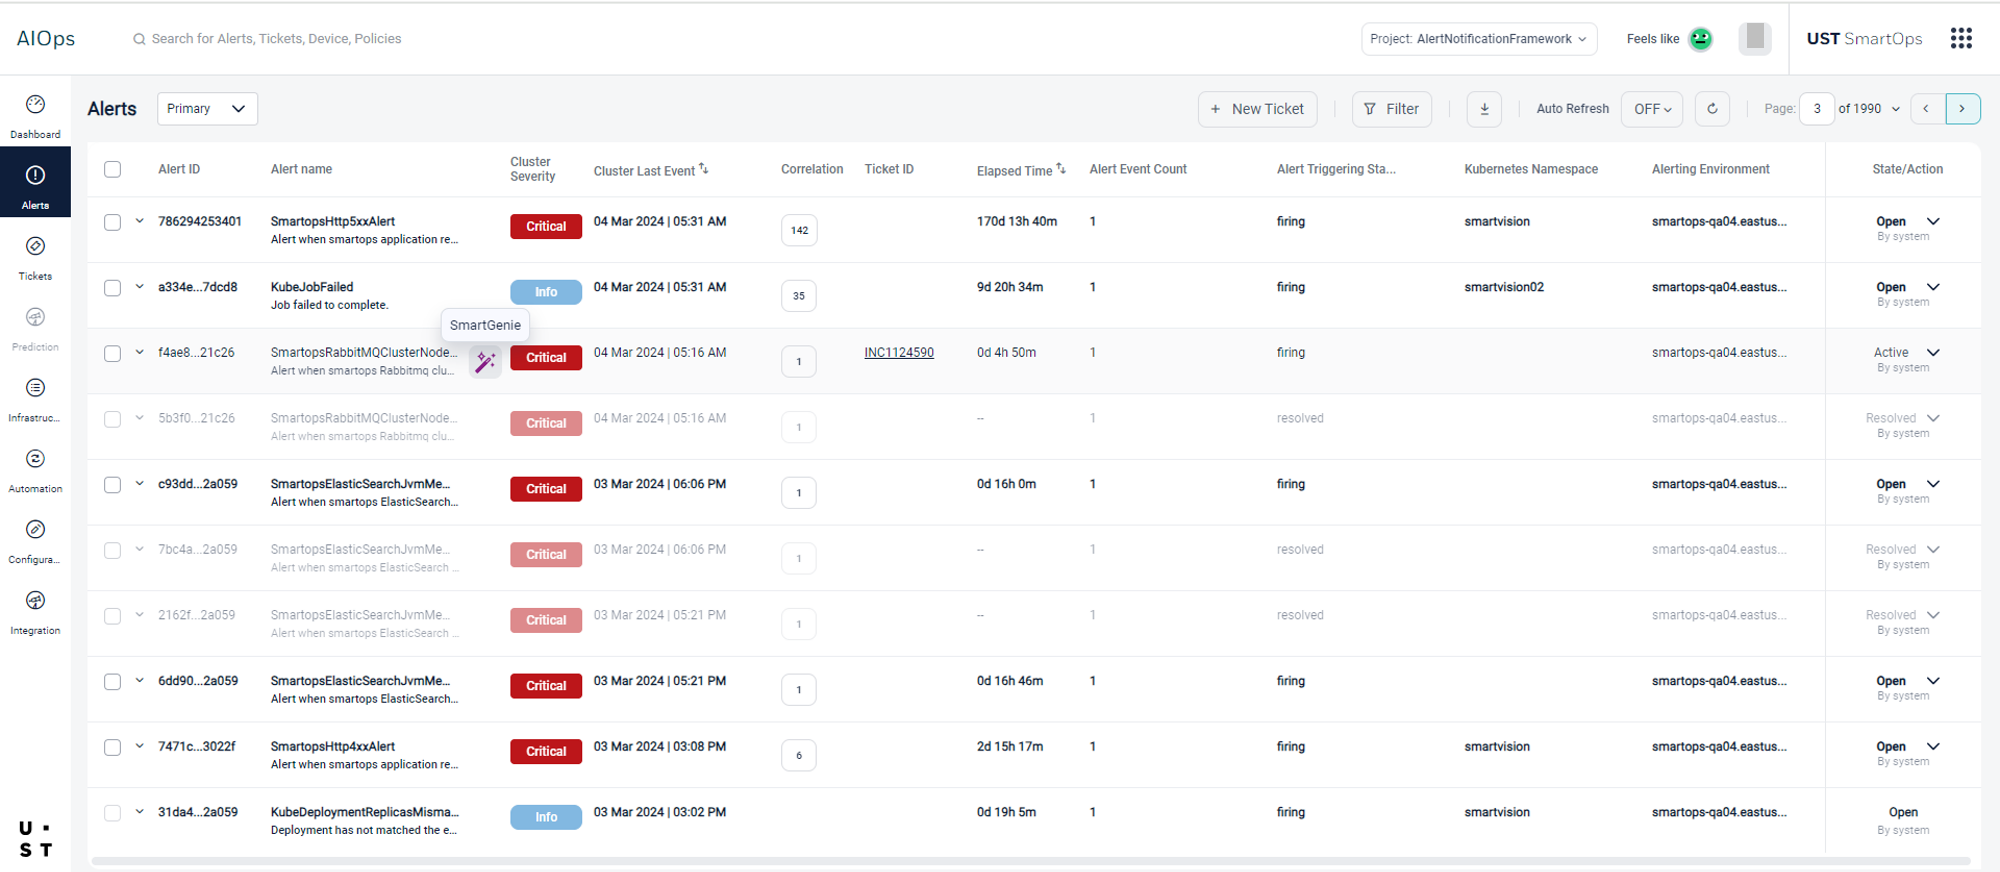
Figure 1:Accessing SmartGENie
|
|
Note: This requires user’s consent to share alert and ticket attributes to openAI LLM model for generating AI summary and hence needs subscription to enable this feature.
It intelligently analyzes the ticket data, extracting crucial details such as affected systems, category and more in real time.
SmartGENie starts by providing a comprehensive overview of the ticket.
By tapping into a vast database of historical incidents, it identifies patterns and presents a comparison with past similar events.
Unraveling the mystery behind each incident, SmartGENie employs advanced root cause analysis.
Through machine learning algorithms, it pinpoints the likely origin of the problem, guiding IT teams towards more targeted resolutions.
It also suggests step-by-step guide for troubleshooting the problem and provides actionable insights for faster issue resolution.
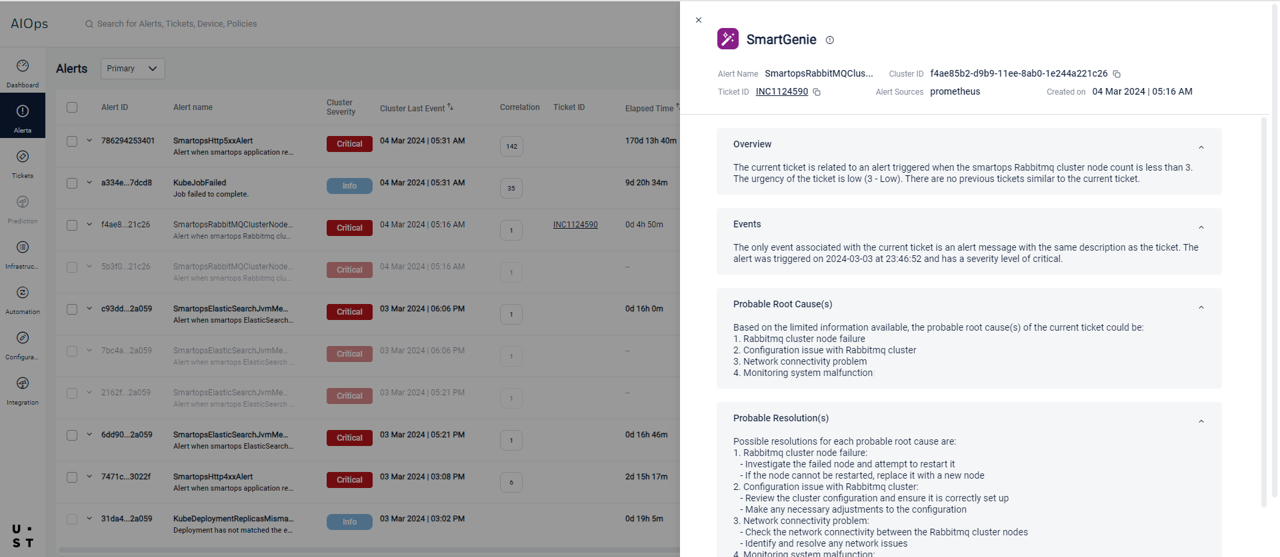
Figure 2: SmartGENie Incident summary
|
Root Cause Analysis from Logs
|
![]() |
|
|
AIOps now supports log based Root Cause Analysis by identifying anomalous points. The capability is provisioned through the ecosystem partnership with 3rd party vendor – Zebrium and hence needs subscription to enable this feature.
|
How does it work?
Zebrium logic:
Log Ingestion > Log categorization > Pattern and Anomaly detection > Root cause report summary
|
|
The Log collectors are used to ingest logs from the respective customer infrastructure which is then categorized into a dictionary of unique event types (all using ML and no additional configurations/rules are needed)
The patterns of each log event are identified to find the anomalous points which tend to be very noisy and in order to separate signal from noise, the ML then looks for hotspots of abnormally correlated anomalies across these logs.
Finally, the hotspots identified above are packaged into concise root cause reports which are then summarized into plain language using OpenAI.
AIOps Logic:
AIOps uses time bound approach to fetch the RCA summaries from Zebrium APIs.
The AIOps RC summary shall be based on the Ticket triggering event start time - 20 mins (Start time) and Ticket triggering event start time + 20 mins (End time) for any given alert cluster.
It then sorts the most relevant RC summaries on the top (uses word mapping from summary against ticket description)
|
RCA summary in Ticket details page
A new tab is introduced in the AIOps ticket details page – ‘Root Cause from Logs’. However, it is made available only for ticketed alert clusters and not stand alone tickets created.
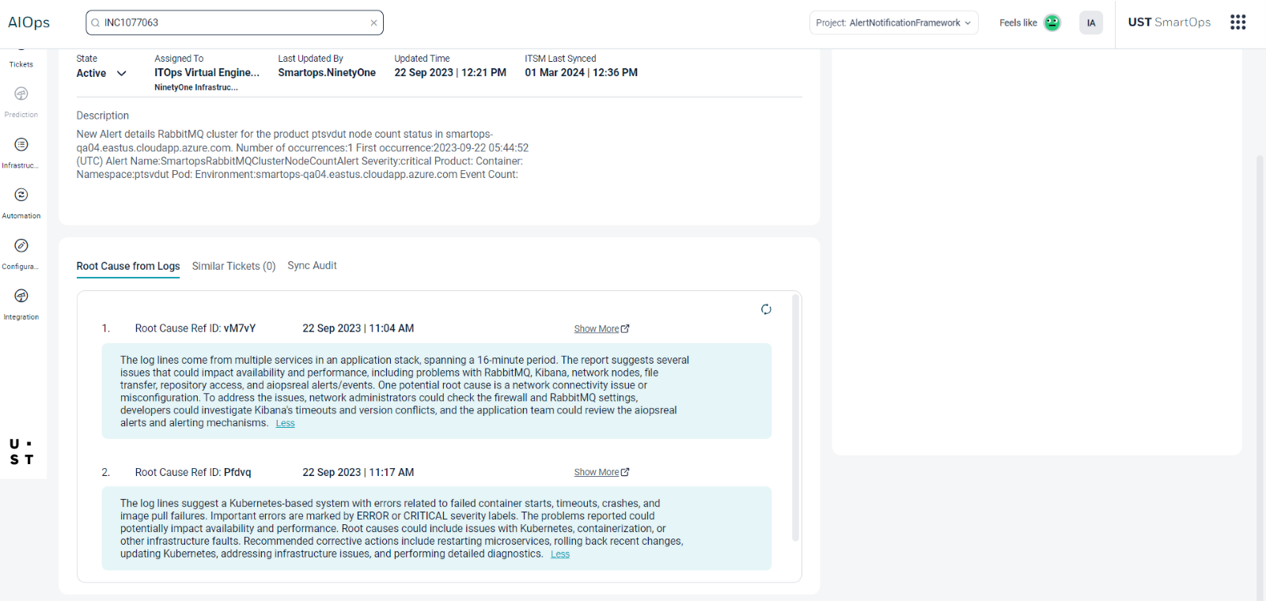
Figure 3: RCA summary from Ticket details page
|
RCA summary in Alert Cluster details page
A new tab is introduced in the AIOps Alert Cluster details page under tickets section – ‘Root Cause from Logs’ and is made available only for ticketed alert clusters.
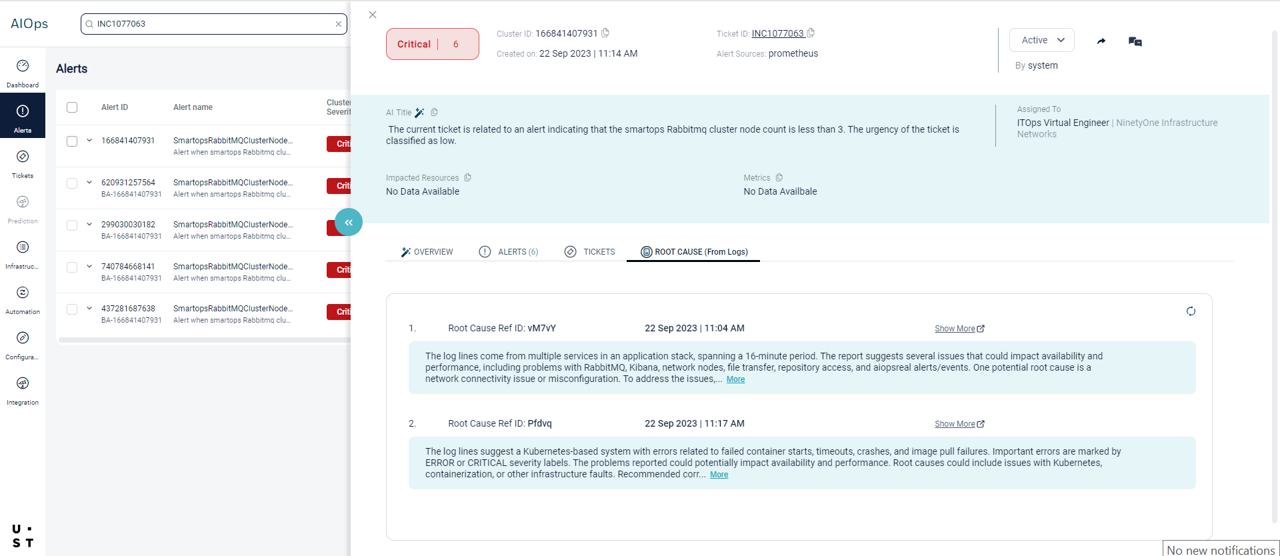
Figure 4: RCA summary from Cluster details page
|
AIOps – Configuration enhancements
Subscriptions
|
![]() |
|
|
AIOps introduces a new configuration – Subscriptions enabling advanced features like SmartGENie and Root Cause from Logs. Subscriptions configuration allows these features to access the necessary data sources and perform their analyses, ensuring that AIOps can effectively support IT operations.
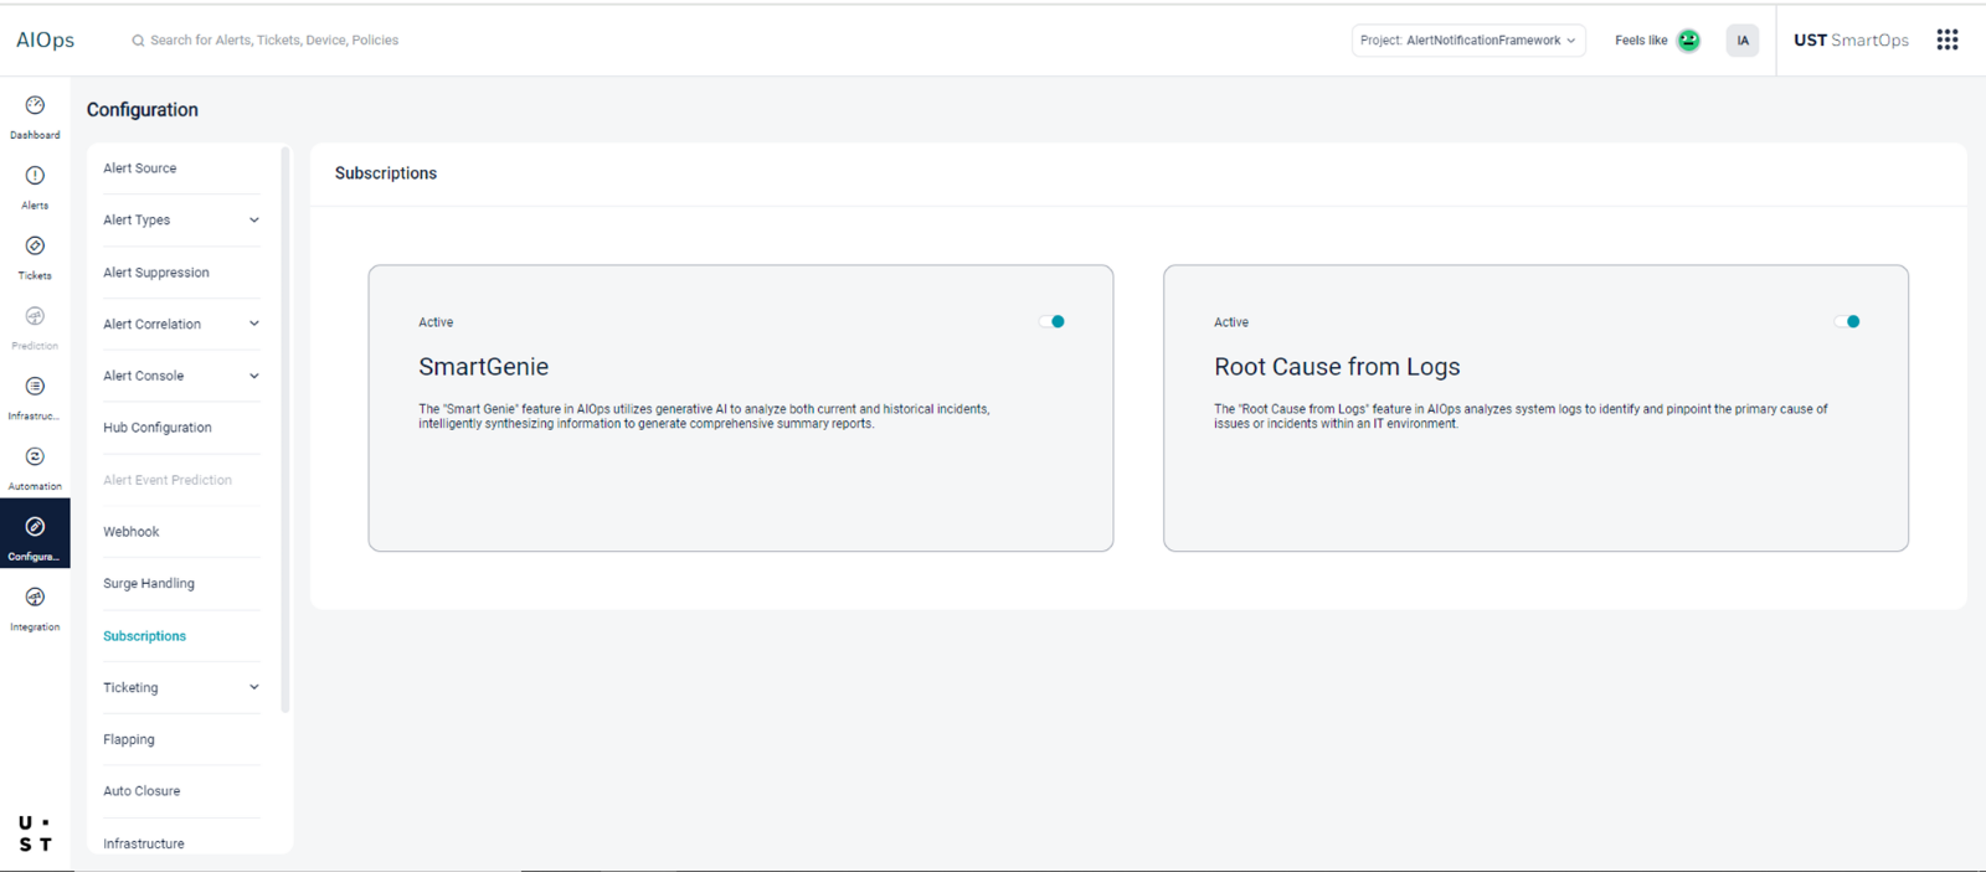
Figure 5: AIOps Subscriptions
|
UI Enhancements 
AIOps Alert Cluster revamp
|
![]() |
|
|
The AIOps alert cluster revamp screen offers an intuitive design and enhanced capabilities, bringing together key information in one place. It provides a cluster summary, giving an overview of the alert cluster's status and impact. Additionally, users can view associated tickets and events, helping to understand the context and history of the cluster. Overall, this comprehensive view enhances operational efficiency and decision-making in managing alert clusters.
|
How does it work?
Accessing the new Alert Cluster page
The new Alert Cluster details page can now be accessed by clicking anywhere on the row for each alert cluster in the listing page
The AIOps alert cluster revamp screen offers two views: quick preview and full preview.
The quick preview provides a condensed overview, highlighting key information such as the cluster summary and high-level insights. It's designed for users who need a rapid understanding of the cluster's status.
On the other hand, the full preview offers a more comprehensive view, displaying detailed information such as all associated tickets, events, and predictions related to the alert cluster. This view is beneficial for users who require a deeper dive into the cluster's data and context to make informed decisions.
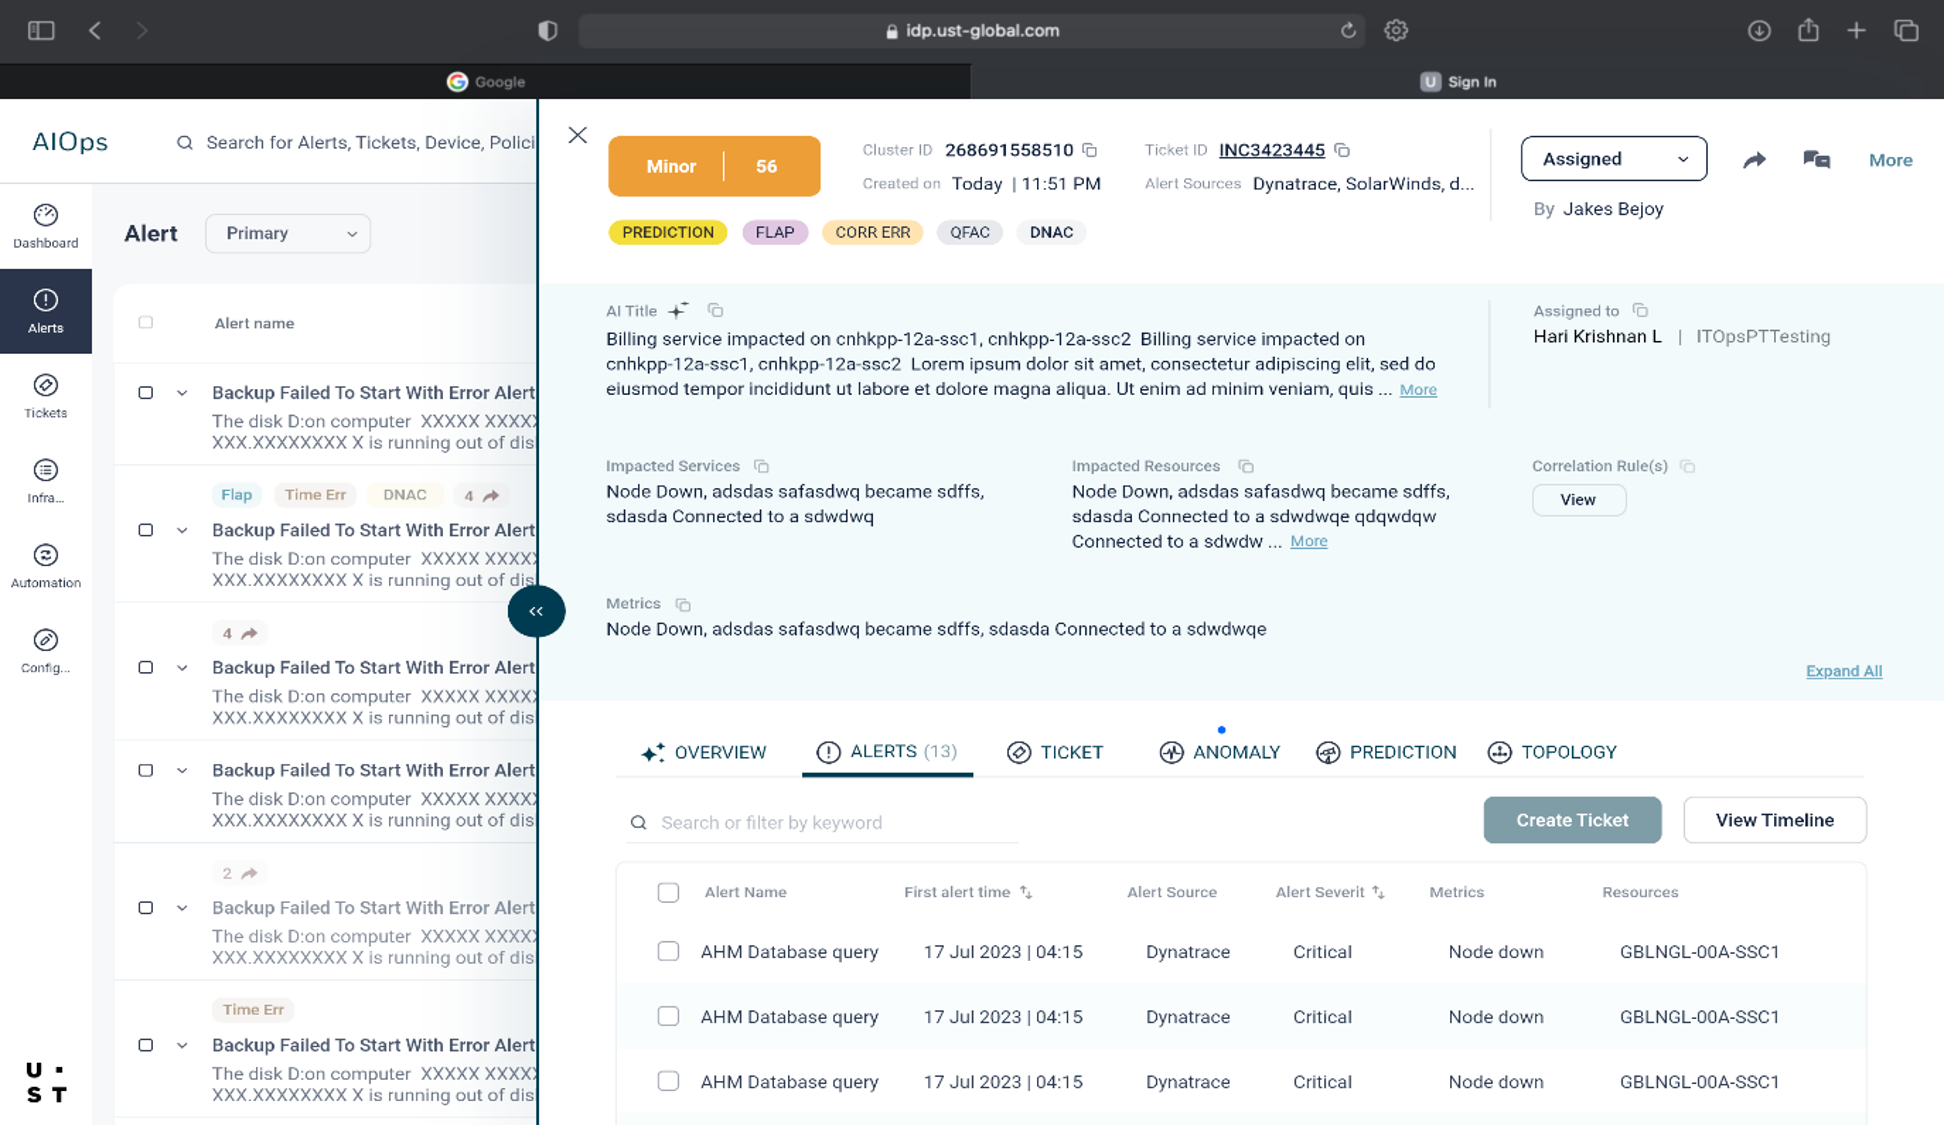
Figure 6: AIOps cluster quick preview
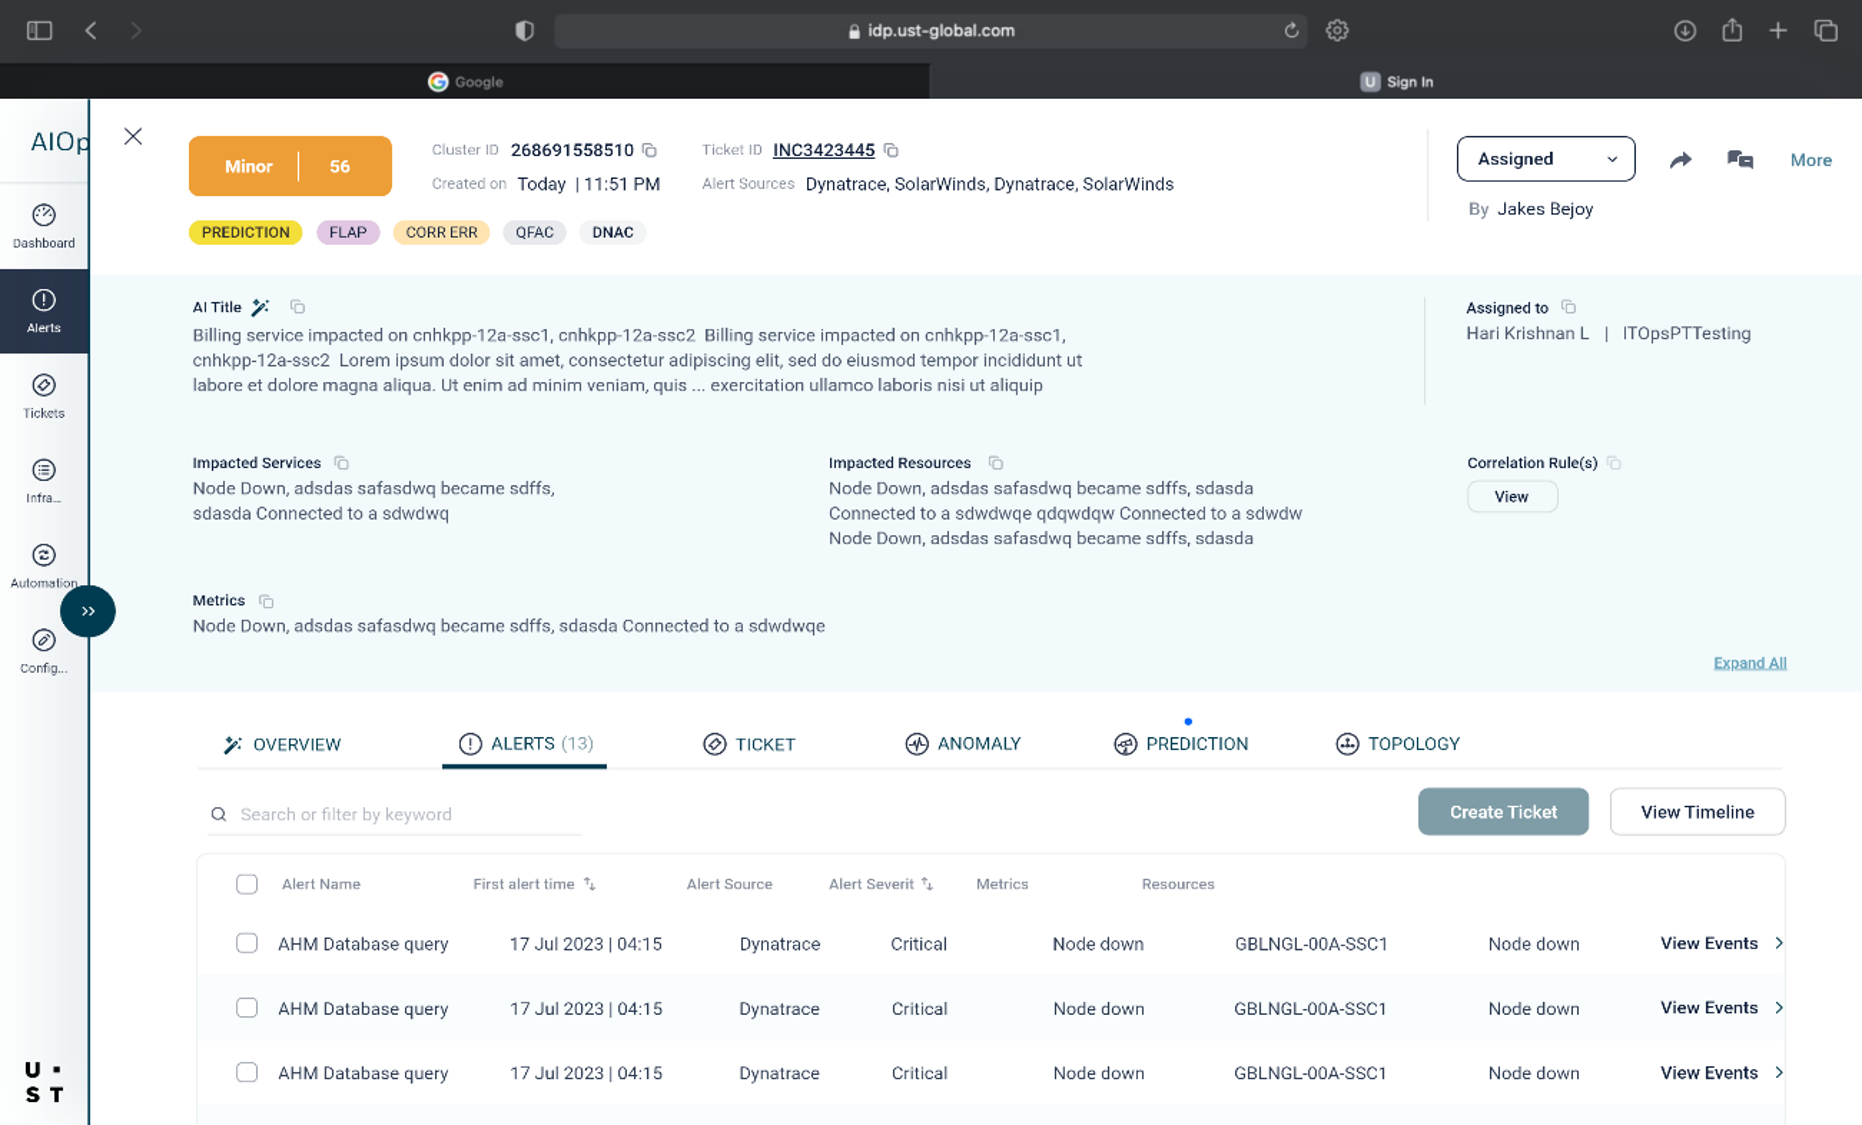
Figure 7: AIOps cluster full preview
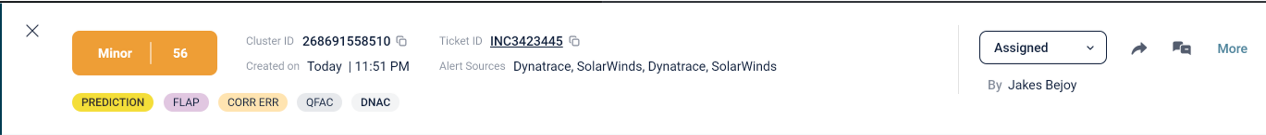
The new cluster details page in the AIOps alert cluster revamp screen includes a header section that displays key information such as the status and alert count, cluster ID, creation date, ticket ID, and alert sources.
Adjacent to this section is a dedicated action section for tasks like assigning the cluster, sharing to collaborative tools, initiating chat, and more.
Additionally, the page shows a list of badges applicable to that cluster, such as FLAP, CORR ERR, QFAC (queued for auto closure), DNAC (Do not auto close), and others, providing quick insights into the cluster's status and any special considerations.
The body of the cluster details page in the AIOps alert cluster revamp screen includes:
- AI Title: generated automatically using our GenAI capability that summarized the alert cluster in plain language text.
- Impacted Resources: Lists the resources affected by the alert cluster.
- Metrics: Shows relevant metrics associated with the alert cluster.
- Assigned-To Information: Includes details about the assigned engineer and group responsible for resolving the issue.
- Correlation Rules: Allows users to view the correlation rules used to correlate different alerts into this cluster, providing insight into how the alerts are grouped and managed.
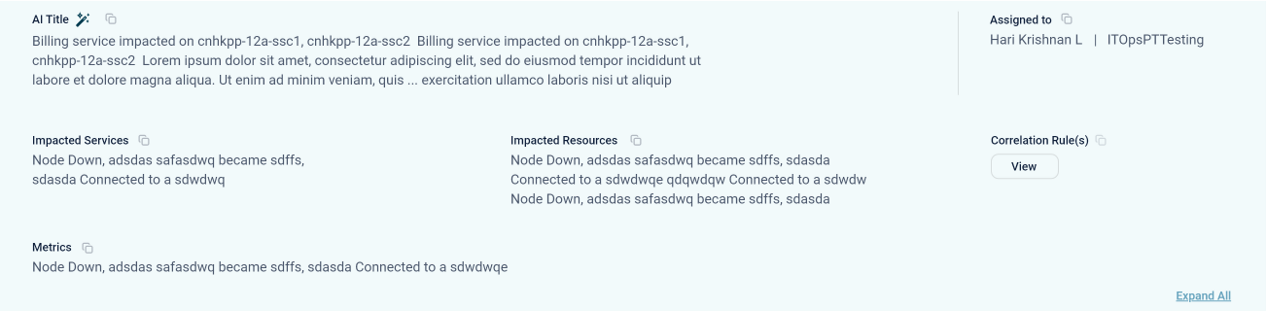
Note: In case the customer does not have the AI Package enabled then the AI Title is replaced by Title which shows the alert message and name of the base alert for this cluster.
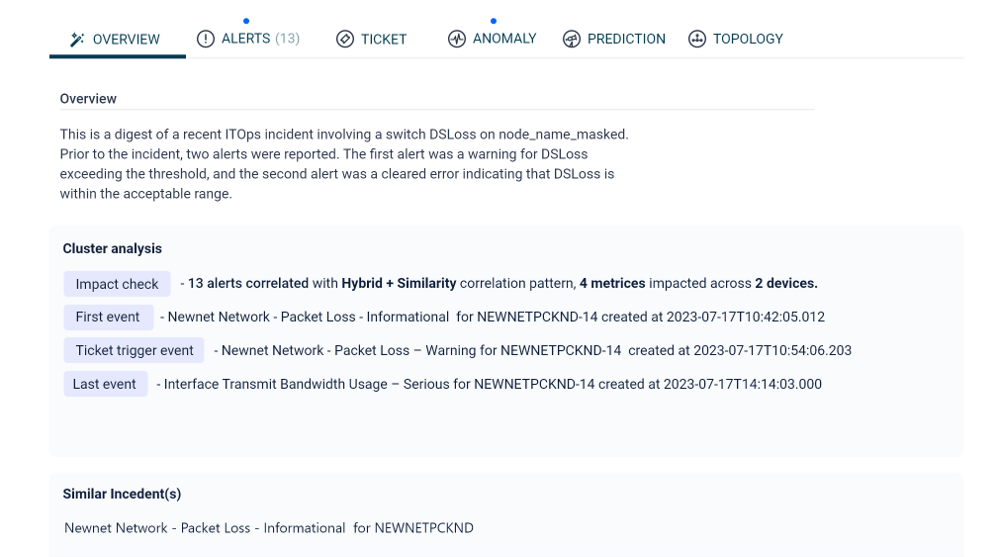
The tabular section of the cluster details page in the AIOps alert cluster revamp screen includes:
- Overview Section: displays the cluster analysis, including Impact check, First event, Ticket triggering event, and the last event of this cluster at the time of viewing. It also shows the incident summary (SmartGENie output)
- Alerts Section Tab: Lists all the alerts part of this cluster and provides an option to view the events for each alert.
- Ticket Tab: Shows the ticket summary related to the cluster, providing a comprehensive view of the cluster's analysis and associated tickets.
|
AIOps – Automation capability enhancements
AIOPS – Changes to the Auto Resolution of Tickets
|
![]() |
|
- Auto Resolution will be triggered only for tickets assigned to AIOps (AIOps specific groups).
- The Auto Resolution for a ticket is triggered only once in its entire life cycle. So, for updates after ticket creation like comment updates, ticket getting reopened etc will not lead to triggering auto resolution.
- The Automation stories will have to handle the resolution of the ticket once it is triggered from AIOps.
- Automation stories should invoke the AIOps APIs to log the resolution status and the resolution status will be displayed from this. API References – click here
|
Technical Upgrades
AIOPS UI - Angular version upgrade
|
![]() |
|
|
Upgrade angular versions of aiops-ui and aiops-ui-external applications
|
Cost optimization by managing production resources according to client needs
|
|
Publish performance and infra baseline for AIOps Edge installation, based on testing with reduced resource configuration similar to an on-prem installation.
|
 |
- (13039) - Muthoot -UI – Alert list is not working properly all times
- (13116) - Muthoot- Sometime ticket details are shown, sometime shown an error in ticket listing
- (12465) - AIOps - Alert event prediction - Discovery pattern is not shown after page navigation
- (13038) - Muthoot-In sync audit, requester details is shown as object
- (13118) - Muthoot- In filters - Cannot view the last time value and the rest of the details
- (12135) - Ninetyone - Filter does not support minutes value
- (18038) - Muthoot - Auto-acknowledging Issue
- (14587) - LoanDepot: Alert not reached in console
- (17899) - PCL- PaaS - ticket queued for auto closure not getting resolved
- (14369) - Loan depot: Correlation Policy attribute file value shows empty
|
|
|
|